Livewire PowerGrid
Component Performance
In this section, we will cover how to measure your PowerGrid Component performance.
Measure Performance
Sometimes you might experience a component that takes too long to render. To find the root of the problem, PowerGrid offers a built-in Performance Measurement tool.
PowerGrid Performance works out-of-the-box, and it can measure metrics like data retrieval time and database query time. In addition, it can inform you if a cache was used and which queries were performed.
These metrics can be very helpful to identify common problems, such as "N+1 Queries", payload size, and overload in PowerGrid's internal table $rows processing.
Retrieve Performance Results
You can access the results of PowerGrid Performance Measurement using Laravel Events or via a dedicated Laravel Pulse card.
Laravel Events
To retrieve the PowerGrid Performance Measurement via event, you must add an event listener to PowerGridPerformanceData::class in your Application Service Provider.
You can use several options to access the data sent with the event. The most straightforward approach is using Laravel Logs.
The example below uses LaraDumps to capture and display the event data. LaraDumps is a free, open-source debug tool that helps you assess your component performance in a convenient way.
// app/Providers/AppServiceProvider.php

use PowerComponents\LivewirePowerGrid\Events\PowerGridPerformanceData;
use Illuminate\Support\Facades\Event;

public function register()
{
    Event::listen(PowerGridPerformanceData::class, function (PowerGridPerformanceData $data) {
        ds($data); //send data to LaraDumps application
        //logger($data); //log data into laravel.log
    });
}
// app/Providers/AppServiceProvider.php
use PowerComponents\LivewirePowerGrid\Events\PowerGridPerformanceData;
use Illuminate\Support\Facades\Event;
public function register()
{
Event::listen(PowerGridPerformanceData::class, function (PowerGridPerformanceData $data) {
ds($data); //send data to LaraDumps application
//logger($data); //log data into laravel.log
});
}The contents of PowerGridPerformanceData $data will look similar to this:
tableName: "DishTable",
retrieveDataInMs: 12.0,
queriesTimeInMs: 8.31,
isCached: false,
queries: [
    0 => [
        "query" => "select count(*) as aggregate from `dishes`",
        "bindings" => [],
        "time" => 23.4
    ]
]
tableName: "DishTable",
retrieveDataInMs: 12.0,
queriesTimeInMs: 8.31,
isCached: false,
queries: [
0 => [
"query" => "select count(*) as aggregate from `dishes`",
"bindings" => [],
"time" => 23.4
]
]Laravel Pulse
PowerGrid can be integrated into your Laravel Pulse Dashboard using the PowerGrid Performance Card.
You can read more about Laravel Pulse in the official documentation.
To configure PowerGrid Performance Card in Pulse, add the following code to the recorders section inside Pulse's configuration file.
// config/pulse.php

use PowerComponents\LivewirePowerGrid\Recorders\PowerGridPerformanceRecorder;

  'recorders' => [
      // ...
      PowerGridPerformanceRecorder::class => [
         'enabled' => env('POWERGRID_RECORD_ENABLED', true),
      ],
  ],
// config/pulse.php
use PowerComponents\LivewirePowerGrid\Recorders\PowerGridPerformanceRecorder;
'recorders' => [
// ...
PowerGridPerformanceRecorder::class => [
'enabled' => env('POWERGRID_RECORD_ENABLED', true),
],
],Next, enable PowerGrid Record in your application .env file adding the key:
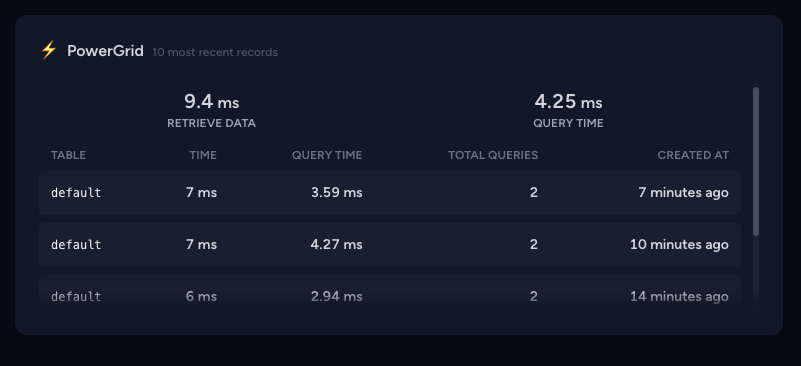
POWERGRID_RECORD_ENABLED=truePOWERGRID_RECORD_ENABLED=trueFinally, add the PowerGrid Performance Card to the Laravel Pulse Dashboard.
// resources/views/dashboard.blade.php

<x-pulse>
    <livewire:powergrid-performance-card />
</x-pulse>
// resources/views/dashboard.blade.php
<x-pulse>
<livewire:powergrid-performance-card />
</x-pulse>Now, when you access your Pulse Dashboard, you should have a card similar to this: